New TransLink report details ridership trends during the COVID-19 pandemic
NEW WESTMINSTER, B.C. – The 2020 Transit Service Performance Review (TSPR) shows that transit remained a vital service for tens of thousands of people during the COVID-19 pandemic, despite the challenges posed by COVID-19 and public health restrictions. TransLink continued delivering more than 620,000 boardings every weekday. Even at the lowest point of the pandemic, approximately 75,000 people still relied on transit every day, including many essential workers.
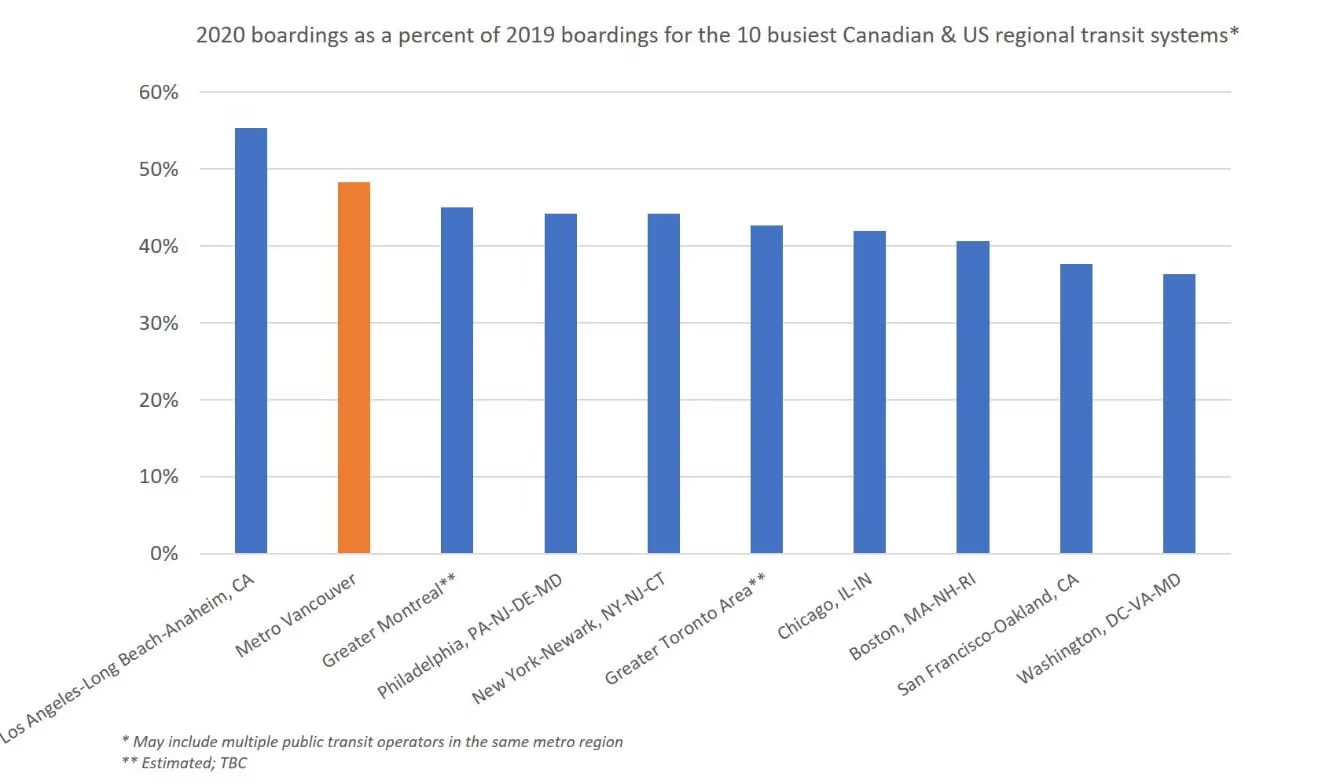
TransLink secured one of the highest ridership retention rates among the 10 busiest systems in Canada and the United States. TransLink retained 48 per cent of its ridership in 2020, second only to Los Angeles. TransLink is fourth in per capita ridership and sixth in total number of boardings. These rankings mainly remained unchanged from 2019 as a similar drop in ridership was experienced across North America.
Working from home and public health restrictions caused ridership in 2020 to fluctuate greatly, leaving no ‘average’ day to analyze for this year’s TSPR. As a result, this report focuses on the most stable eight-week ridership period between September and November. This period provides the most relevant data because it indicates how customers are likely to use the transit network as the region recovers from COVID-19.
2020 Ridership Trend Highlights
-
Most of our bus ridership (85%) continued to be carried on routes that provide frequent service throughout the day and during peak periods. Eight of the top 10 busiest bus routes in 2019 were still among the top 10 routes by boardings.
-
Ridership on bus routes that serve essential workers remained strong in 2020, including routes that primarily serve industrial areas, such as routes 116, 175, 418, and 640.
-
Commuter services to Downtown Vancouver and routes that exclusively serve university/college campuses saw significantly lower ridership recovery. The West Coast Express recovered to 17% of 2019 ridership. Bus routes that exclusively serve campus-bound customers recovered to 20% of 2019 volumes.
-
The Southeast sub-region (Surrey, Langley, North Delta, and White Rock) saw the highest return of bus ridership, with volumes at 55% of 2019 levels – higher than the bus network average of 44%.
-
HandyDART continued to provide critical access to medical services and other important destinations. While overall HandyDART ridership was down, HandyDART customers made 100% of dialysis appointment trips, 78% of cancer appointment trips, and 57% of general medical appointment trips, when compared to 2019 numbers.
“Emergency relief funding from the Federal and Provincial Governments helped us maintain near-normal service levels, ensuring people had transportation for work and access to essential services,” says TransLink Interim CEO Gigi Chen-Kuo. “Our ability to provide fast, reliable and safe service throughout the pandemic has been crucial to B.C.’s recovery, particularly as the economy gradually reopens and more customers return to using transit regularly.”
Fall 2020 Ridership by Mode
| Mode | Ridership compared to pre-COVID levels |
|---|---|
| System-wide | 41% |
| Bus | 44% |
| Expo and Millennium Lines | 39% |
| Canada Line | 32% |
| SeaBus | 30% |
| West Coast Express | 17% |
| HandyDART | 37% |
Top Ten Busiest Bus Routes
-
99 Commercial/Broadway/UBC
-
R4 41st Ave. (replaced route 43 and part of route 41 in 2020)
-
49 Metrotown Station/Dunbar Loop/UBC
-
319 Scott Rd Station/Newton Exchange/Scottsdale
-
20 Victoria/Downtown
-
25 Brentwood Station/UBC
-
16 29th Avenue Station/Arbutus
-
9 Boundary/Commercial-Broadway/Granville/Alma/UBC
-
R1 King George Boulevard (replaced 96 B-Line in 2020)
-
19 Metrotown Station/Stanley Park
More information:
2020 Transit Service Performance Review
Media contact:
TransLink Media Relations
E: media@translink.ca